


Our scoring woes explained

Dan Cooke cracks open the numbers to find the real reason we’ve struggled to put the ball in the net this season.
Friday night was the 15th game this season where we have failed to score. We haven’t scored in 10 of our 17 home games. Scott Parker deserves a lot of credit for how he has turned us into a pretty defensively stable side, but in this relegation run-in, we knew we needed wins, and we simply aren’t scoring enough goals to get them.
The question is why? Before I started writing this article, I had my own preconceptions on what our issues are. But I’ve looked into the numbers to try and find the real reasons behind our attacking impotence.
Cold, hard, facts

That table tells a damning story. 24 goals in 32 games is difficult reading, and at times it has certainly been difficult to watch. For me, there can be two headline reasons behind not scoring goals: not creating chances and/or not converting chances.
Chance creation
Overall, I think we’ve moved the ball pretty well at the back and in the middle of the park. Yes, there have been errors and games where we haven’t done it so well, but when compared to the teams around us, we are superior to most on the ball. However, I think we’ve struggled once we progress into the final third. From watching our games this season, we seem to struggle to create good quality chances and lack a spark in attack.
So, how good are we at getting the ball into dangerous areas? Starting simple, I would say that you want your team to be getting passes into the attacking third and, crucially, get the ball into the box. These are positions that you can create chances and shooting opportunities from.

Looking at the numbers, we are actually very good at getting passes into the box. We play more successful passes into the box than teams such as Leicester, Spurs and Everton. Other than Brighton, we successfully play the ball into the final third and box more than our relegation rivals. Ultimately, we are getting the ball into the parts of the pitch you need to be in to score goals.

This is backed up by how many touches we have in the opposition box. We once again rank pretty well, sitting ahead of most of our rivals and the teams ahead of us are high-scoring sides competing at the other end of the table (minus Brighton).
I understand that people will rightly say that having the ball in the box doesn’t necessarily mean you’re creating chances. That’s quite right; there are areas of the box that are certainly less threatening to have the ball than others. So the logical next step is to look at our xG. I’m aware there are xG critics, but it is a great measure of the quality of chances that are being created. In Layman’s terms, a higher xG means you are shooting from ‘good’ areas and so are fashioning good chances. Non-penalty xG would perhaps be the best measure of pure chance creation, but I think it makes sense to include penalties, as you’ve effectively still created a chance by winning a penalty.
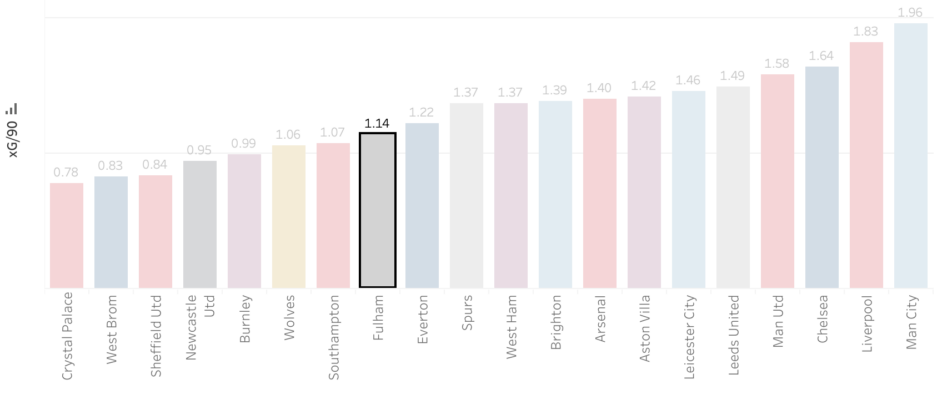
We can see we drop down the rankings slightly when it comes to xG compared to the previous measures. However, if you look at the teams we rank above, they are exactly the teams that we would target to do better than (barring freak of data Brighton). Based on these numbers, we are creating the necessary chances to score just over a goal a game.
So from a data standpoint, compared to our peers, we aren’t struggling to create chances. We move the ball into good areas and the shots we are having are from good positions. Therefore, the next thing to look at is our ability to convert these chances.
Chance conversion
As some may have spotted, if we’re creating chances to score over a goal a game, but we’ve only scored 24 in 32, then here lies the issue. However, breaking it down step by step should help build a clearer understanding.

If we plot xG against actual goals scored, we can visualise our woes. If you sit above the dotted line, you’re scoring more goals than you would expect based on your xG, below the dotted line and you are scoring fewer. As you can see, we sit well below the line. Palace, Southampton, Newcastle (for ease, please just ignore Brighton from now on, they’re a pain) all sit above the line. Some of our key rivals are scoring more than they ‘should’ be and that’s important, because if we did the same, we’d be looking at upwards of eight extra goals and consequently, the points that go with those goals. It’s the difference between converting losses into draws and draws into wins.
But why? Why are we so badly underperforming our xG? There’s another piece of data called Post-Shot xG (PSxG). It is mainly used to asses the shot stopping abilities of goalkeepers. Where xG looks at the chance of a goal based on where the shot is taken from (including many other factors), PSxG looks at the chance of a goal based on the quality of the shot itself, how easy/hard the shot was for the goalkeeper to save. Therefore, we can look at the quality of shots that we are taking.

With this graph, if you sit around the vertical line (the overall league average), you are effectively taking the quality of shot that you would expect based on where you are shooting from. To the right of that, you are taking better shots, and the further left you go, the less you are testing the keeper. That’s where we sit. Despite on average having an xG/90 of 1.14, we are turning those chances into a PSxG of 0.94. Put simply: our finishing is poor. A difference of -0.2 per game might not sound like a lot, but after 32 games that’s a total of -6.2. So based on our xG, we have created chances to score 35 goals this season, but based on the quality of our finishing, that drops to 29 goals.
This can partially be explained by our inability to hit the target. Just 29% of our shots are on target, which is the second worst percentage in the league (Brighton having the worst, obviously). It’s clear that our problems this season lie with our finishing.
I think it’s important to look at all of the graphs and pick out not just where we are, but where our rivals are. It helps paint a picture as to why we’re now six points adrift. There are teams above us that we could definitely claim to be better than in all areas apart from one. Unfortunately, it’s the most important one – putting the ball in the net.
Why can’t we finish?
We could probably dig deeper, look at many other graphics, and crunch more numbers, but for me it boils down to one thing: our forwards aren’t good enough.
That may sound harsh, and I don’t like writing this, because I love this squad; I think a better way to put it is we have a lack of experience. On a whole our squad doesn’t have a lot of goals in it, not just this season, but historically. Most importantly, our squad doesn’t have many top flight goals to their names at all. We do not have a proven, prolific goalscorer at a Premier League level. I went through our rivals’ attacking banks, and counted up the number of goals that they have scored in Europe’s top five leagues, and it explains a lot.

Mitrovic sits top for us, with just 24 top flight goals. If we look across the list, you can argue that some of these players aren’t the most prolific, but for me they make the difference. Callum Wilson has 10 goals this season, that could be what keeps Newcastle up. Zaha has nine, and Chris Wood has seven. Those goals will almost certainly keep their teams up.
Contrastingly, our historically most prolific striker is having his least prolific season. Mitro has only managed three league goals this year, but without his goals last season, we probably wouldn’t have been promoted. And without them this season, we’re probably going to be relegated. We’re relying on other players to step up, and in fairness to them, Bobby Decordova-Reid and Ademola Lookman have tried to pick up the slack, but it’s not been enough.
It was spoken about in the summer and even more so in January, but we were – and still are – crying out for a goalscorer. Unfortunately, we didn’t find one. I think Mitro is good enough, but he’s had a torrid season and lost his place to Cavaleiro. I’m not blaming Cav, but in his career he has managed 10 top-flight goals, he’s not a natural finisher. So, it’s no surprise that we haven’t scored many, because if your top striker isn’t putting the ball in the net, who will?
For me, that top striker is the difference between survival and relegation. And sadly, in this case, his name is Callum Wilson.