The Stats Factory: Butts vs Betts
Written by George Singer on 17th January 2018
In the latest edition of the Stats Factory, George Singer takes a deeper look at the whole Button and Bettinelli debate which has been particularly divisive amongst the Fulham fanbase this season, with neither keeper looking completely comfortable between the sticks for the Whites.
Hello and welcome to a slightly different article. I wanted to take a look into the “Betts vs Butts” debate, an argument which has plagued Fulham fans pretty much since Button joined from Brentford in 2016, but which has been even more prominent over the course of this season.
It’s fair to say that David Button hasn’t been a fan favourite since his move to the Cottage, with plenty of people continually calling for him to be demoted to the bench. After taking the place of home-grown Bettinelli, and struggling to hit the heights of some previous Fulham keepers, it’s commonplace to see fans to get on Button’s back – even during games. However, is Bettinelli really a better choice than Button? Or are Fulham fans watching games with rose-tinted glasses?
I wanted to look at the argument in a different way, by using data to see if that helps give an answer as to which player should take the position between the sticks. In this article, I’ll be looking into the keepers’:
- Shot stopping ability
- Distribution profile
There are certainly other important facets of a keeper’s game, such as commanding a defence. However, in an attempt to keep this piece somewhat concise, I’ve decided to start by looking at these two factors.
Shot Stopping
I’m attempting to answer the question by generating a metric called ‘expected goals conceded’, or ‘xConceded’. This metric calculates the number of goals an ‘average’ keeper would expect to concede, looking at the shots that each keeper has faced.
For example, if a keeper faces lots of shots from positions very close to the goal, their ‘xConceded’ will be high. At the foot of the article is an explanation as to how this factor is generated – so please jump there if you want more detail.
By looking at the ratio of ‘xConceded’ vs ‘how many goals are actually conceded’, this gives you a way to rank the shot stopping ability of each keeper. It also allows you to account for any impact of a keeper playing against inferior opposition, or sitting behind a better defence.
So how do the keepers in the Championship compare to each other?

To read the graph, look at how keepers compare to the black line (which shows where ‘xConceded’ equals ‘actual conceded’ – the line for an ‘average’ keeper)
- Keepers above the black line concede more than expected (ie J. Steele is the worst shot stopper)
- Keepers below the black line concede less than expected (ie S. Johnstone is the best shot stopper)
So what does the graph show us? To me, it suggests two things:
- Bettinelli is slightly stronger than Button at shot stopping – conceding slightly less goals compared to the expected
- Button and Bettinelli are both reasonably pretty average at shot stopping – both being very close to the black ‘average’ line
One thing to keep in mind is Bettinelli has played about a third of league games compared to Button this season. Therefore, as he plays more games, his position on the graph change may fluctuate. However, for now, it looks like Betts is very slightly better at shot stopping.
Distribution
To analyse the two keeper’s distribution, I wanted to look at 2 things:
- Which keeper is more accurate with their long passes?
- Which keeper tends to play shorter passes?
Let’s start with accuracy – which keeper tends to hit the target with their longer balls?
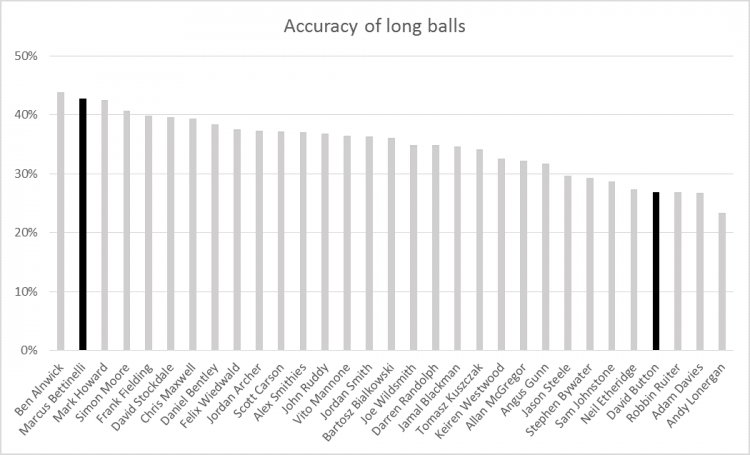
This graph surprised me – showing a startling difference between the accuracy of the two Fulham keepers. There are a few reasons why this could be the case, for instance the off-putting tendency for Fulham fans to sarcastically cheer whenever Button sends the ball long.
However, reasons for this difference aside, it looks like Bettinelli again beats Button here, and seems to be one of the more accurate distributors in the league when playing the ball long.
In this next graph, I wanted to look at is what percentage of balls are played short for the 2 Fulham keepers over the last 4 seasons:
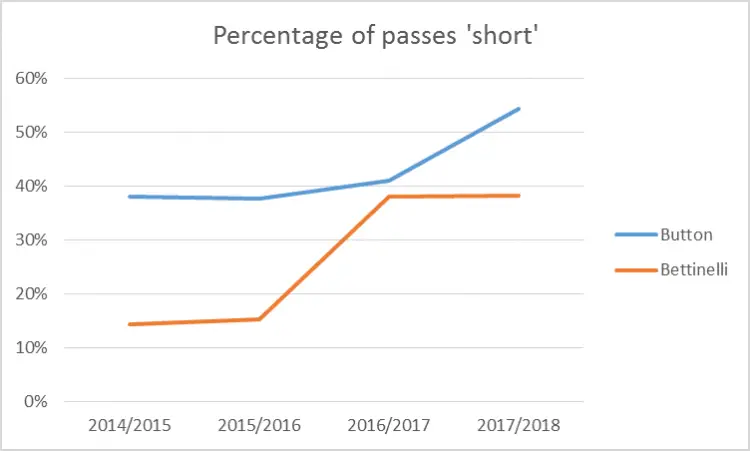
Firstly you can see that both keepers, since working under Jokanovic at Fulham, have increased the amount of short balls they play. This is perhaps not surprising, considering Slav’s preference to play out the back; something he will no doubt be drilling into them on the training ground. In fact, Fulham’s keepers tend to play more short balls than anyone else in the league:
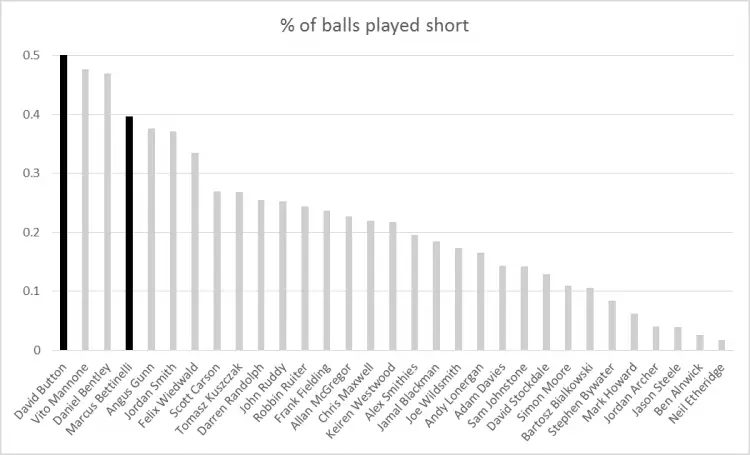
Secondly – Button is playing a higher number of shorter balls compared to Betts. Assuming that both keepers are given the same instructions, and the same training, is this a sign that Button is being more obedient to Slav’s instructions? Perhaps this is one of the main reasons why Slav tends to prefer to play Button.
Summary
For me, the data shows that Bettinelli should perhaps have the edge over Button as a first choice keeper. Marcus looks to be a slightly better shot stopper, and more accurate with his distribution.
With this kind of data at his fingertips, this is unlikely to be news to Slavisa. Therefore, it looks like Jokanovic has been preferring an obedient Button, over a (perhaps) more talented Bettinelli, which does make some sense in terms of the style Slavisa tends to drill into his sides.
However, especially for shot stopping, neither of the keepers are league leading. Whilst they’re certainly not bad keepers, with a place in the playoffs looking like it’ll go down to the wire again, perhaps an upgrade to a stronger keeper could give Fulham the edge we need in our attempt to make it to Wembley.
__
Extra stuff: Method – how do you generate ‘xConceded’?
This is done by taking the following steps:
- Look at all the shots taken in a league that hit the target (i.e. were ‘saved’ or a ‘goal’)
- Categorise shots into clusters of similar shots
- For each cluster, work out what proportion ended up in a goal
- For each goalkeeper, total the shots in each cluster, multiplied by the proportion of goals from each cluster
- Total how many goals each keeper has actually conceded
- Divide each keeper’s stats by 90 minutes played
- Order by ‘xConceded’ / ‘actual conceded’
Why take these steps?
- Just looking at ‘goals conceded’ doesn’t take into account the strength of the opposition faced, or how strong the keeper’s defence is
- Only look at shots which hit the target. The keeper has no control over shots which were blocked, or off target, so should not play a role in determining the skill of a keeper
- By dividing by 90 minutes, keepers who have a variety of playing time can be plotted together
This article was written with the aid of StrataData, which is property of Stratagem Technologies. StrataData powers the StrataBet Sports Trading Platform, in addition to StrataBet Premium Recommendations.

